Enhanced endpoint metrics with Citrix Monitor and Director
As some of you may have already noticed, in July 2024, Citrix significantly enhanced the “Session Performance” tab in Citrix Monitor by adding the following endpoint metrics:
- Wi-Fi signal strength (if applicable)
- Incoming and outgoing throughput
- Type of network interface
- Link speed
You can read more about it here: What’s new | Citrix DaaS | July 2024 (scroll to “Enhancement to Session Performance tab”).
It looks pretty much like this:
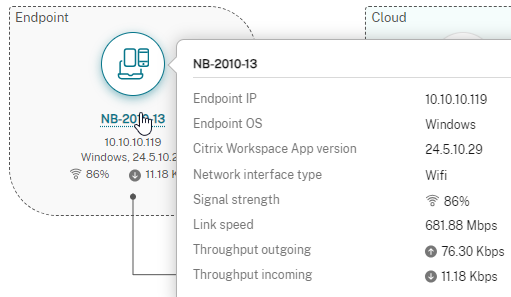
To have these metrics at hand is incredibly useful when troubleshooting why Citrix isn’t performing as expected.
We all know that 95% of Citrix issues have nothing to do with Citrix itself. 😉
The metrics shown above are available by default with VDA 2407 and later, as well as Citrix Workspace App 2405.10 and later (haven’t tested a older version).
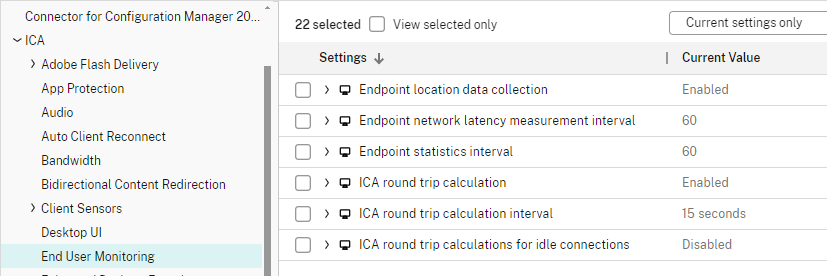
By default, the metrics refresh every 60 seconds, and the ICA RTT is calculated every 15 seconds. However, you can adjust this according to your needs using the following policies (ICA > End User Monitoring):
There are some limitations, though. If you need real-time information, you’ll still need third-party products like ControlUp.
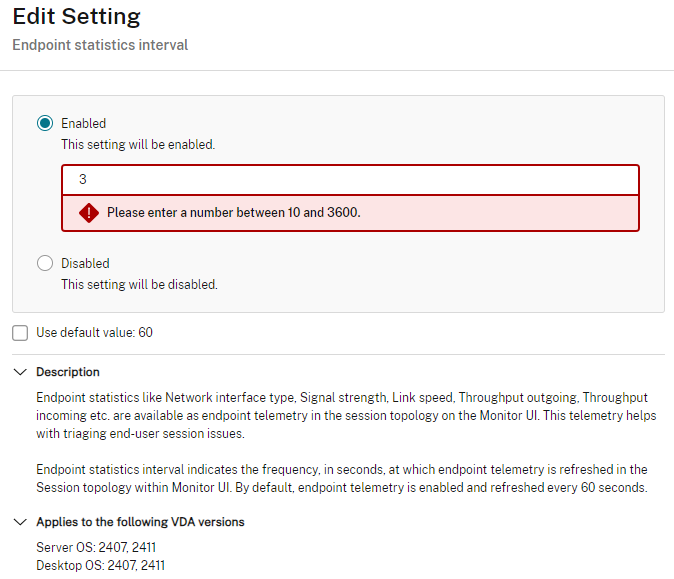
The “Endpoint statistics interval” allows values between “10 and 3600” seconds.
With the release of CVAD 2407, these metrics were also introduced into Citrix Director!
But there’s even more!
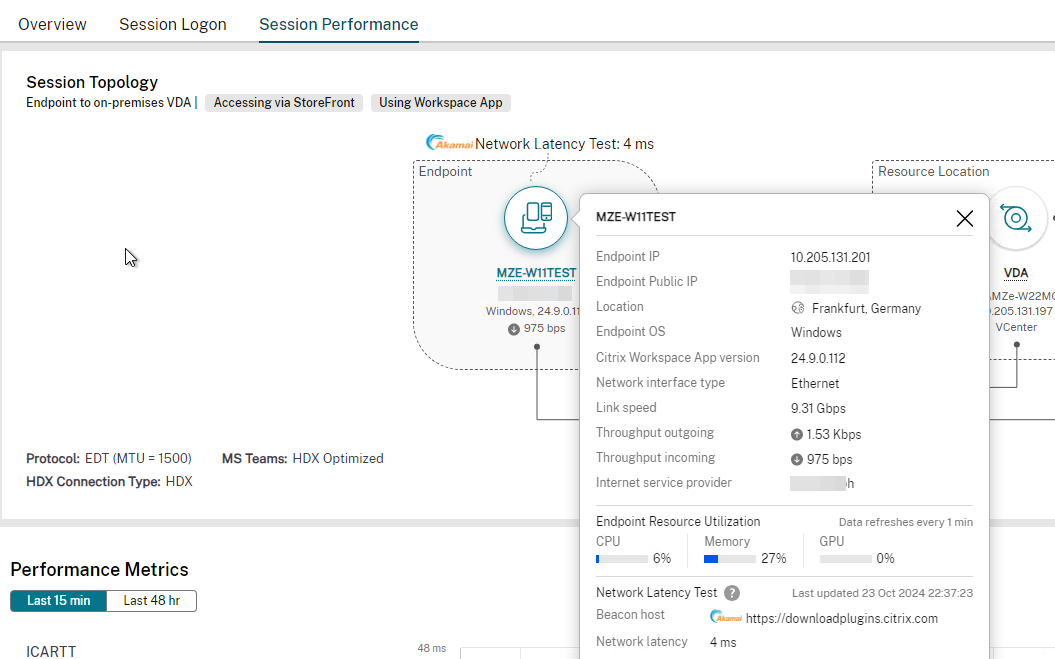
With the upcoming VDA 2411 release, additional metrics will be available within Monitor/Director:
- Protocol: Displays the MTU value for the EDT protocol (Single- & Multi-Stream)
- MS Teams optimization
- HDX Connection Type (HDX, HDX Direct, or Rendezvous)
- Frames per Second: Input & Output
In conjunction with Citrix Workspace App 2409 for Windows, the following metrics will also be added:
- Public IP address
- ISP
- Location
- Using Workspace App or HTML5
- Accessed using Workspace or StoreFront
- Endpoint Resource Utilization (CPU, Memory, GPU)
- Network latency
And overall, it will look like this:
The 2411 release promises even more exciting features worth checking out even for the On-Prem folks.
Check Citrix downloads for the Early Access Release (EAR) and provide feedback to them 🙂
2 thoughts on “Enhanced endpoint metrics with Citrix Monitor and Director”
Roland van der Kruk 17-10-2025 at 15:31
hi, if you do a custom install, I am currently looking for the option to enable this in the VDA installation but I cannot find that info yet.
Markus Zehnle 21-01-2026 at 13:54
Hi Roland,
thanks for the comment.
As far as I know there is no additional command line switch for VDA to activate the advanced metrics.
You have to enable them via Citrix Policy if they are not enabeld by default…